Relative to the State and the South-East Region, County Carlow’s demographics are characterised by, an above-average level of population growth, particularly over the past decade; a younger age profile; and greater demographic vitality.
Population Change
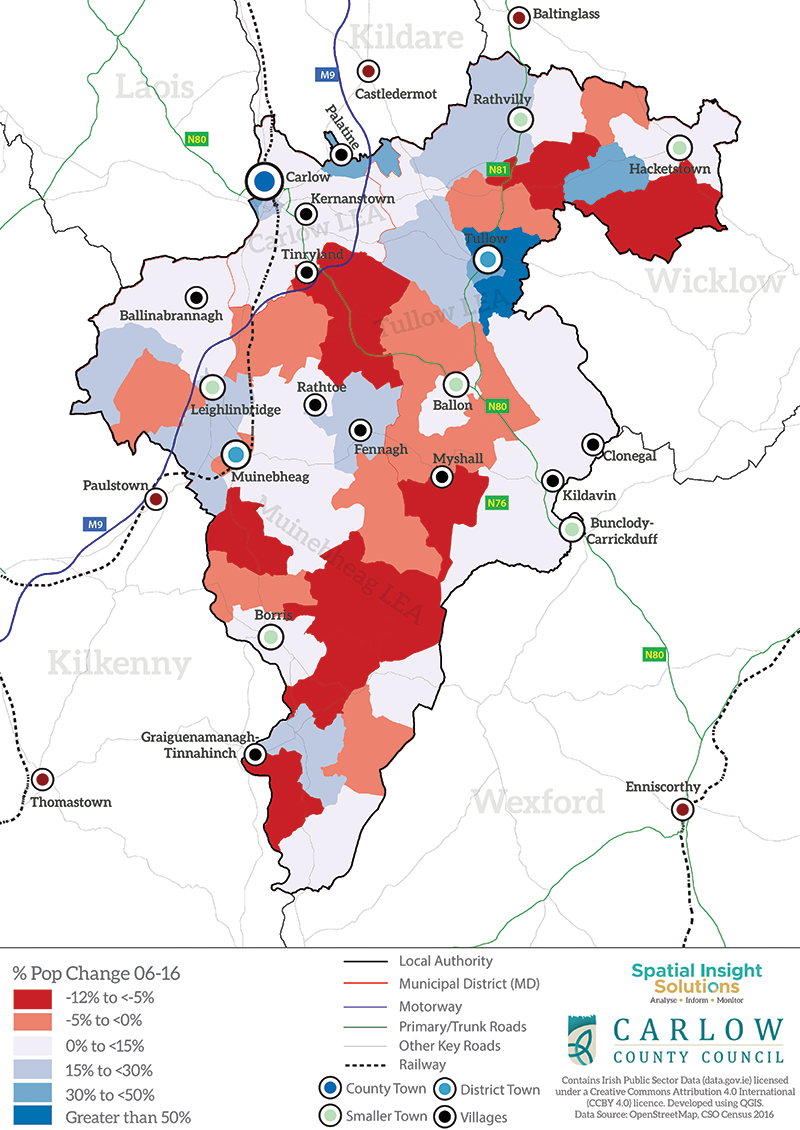
County Carlow’s population in the 2016 Census stood at 56,875, an increase of 2,263 (4.1%) persons on the recorded 2011 Census (54,612). Over the ten-year period 2006-2016 the population of County Carlow grew by 13.1%. The influence of the Greater Dublin Area is evident in Carlow’s spatial patterns in respect of population change. Growth rates are consistently highest in those parts of Carlow that are most accessible to Dublin. These include towns and villages in the north of the county, namely Tullow, Palatine and Rathvilly, and settlements along the M9 in the west and northwest of the county, including Ballinabrannagh, Kernanstown and Leighlinbridge. The outskirts of Carlow Town has also experienced population increases, and there is evidence of a demographic recovery in the town core as well.
In contrast, population levels are more stagnant in rural Carlow, and areas of decline persist in parts of the south. Population decline was greatest in Tinryland and across rural parts of County Carlow generally. Above-average levels of decline were experienced in Rathanna and Killedmond – between Borris and Mount Leinster. Decline also occurred, although to a lesser extent, in Graiguenamanagh and St Mullin’s and in the rural areas surrounding Hacketstown and Bagenalstown.
Figure 1: Population Change 2006-2016 (source; A Socio-Economic Profile of Co. Carlow 2019)
Population Profile
Carlow has a younger age profile than Ireland as a whole. The county has proportionately more persons in all five- year age cohorts up to age 24. Carlow has proportionately fewer persons in their late twenties and thirties, and fewer persons aged 65+. The specific age profile of the county places varying demands on public service provision including childcare, education facilities and healthcare. In terms of family lifecycle Table 1 indicates an older age profile in the Bagenalstown MD, and to some extent in the Tullow MD, relative to the Carlow MD. The Bagenalstown MD has the highest proportions of families in the three most mature stages of the family life cycle namely, families with adult children, empty nesters and retired households. In contrast, the Carlow MD has proportionately more households with children. Indeed, the proportions in the Carlow MD are higher than the regional average in respect of the four child-related stages in the family life cycle. In addition, the Carlow MD has a higher proportion of families in the pre- family stage.
Table 1: Family Life-Cycle State – Carlow in comparative context, 2016 (source; A Socio-Economic Profile of Co. Carlow 2019
|
|
Pre-Family
|
Pre-School
|
Early School
|
Pre-Adolescent
|
Adolescent
|
Adult
|
Empty Nest
|
Retired
|
|
State
|
9.2%
|
10.0%
|
11.9%
|
11.4%
|
12.3%
|
25.1%
|
10.0%
|
10.0%
|
|
SE Region
|
6.9%
|
9.3%
|
11.6%
|
11.9%
|
13.4%
|
24.7%
|
11.5%
|
10.8%
|
|
Carlow County
|
7.3%
|
9.9%
|
11.9%
|
12.5%
|
13.1%
|
24.9%
|
10.8%
|
9.6%
|
|
Carlow MD
|
8.7%
|
10.7%
|
12.4%
|
12.4%
|
13.3%
|
22.3%
|
10.4%
|
9.8%
|
|
Tullow MD
|
7.1%
|
9.9%
|
12.3%
|
13.3%
|
13.1%
|
24.4%
|
10.9%
|
9.0%
|
|
Bagenalstown MD
|
5.7%
|
8.8%
|
10.9%
|
11.7%
|
12.9%
|
28.9%
|
11.1%
|
9.9%
|
Housing
There were 23,274 units in County Carlow in 2016, an increase of 16% since 2006. About two thirds of homes are privately owned. Houses (detached, semi-detached and terraced) and bungalows represent the dominant type of housing comprising 87% of units in Carlow, 10% comprising flats and apartments with other types of housing representing the remaining 3%. In County Carlow 33% of the housing stock has been built since 2001. Less than 3% of the housing stock in the county was built between 2011-2016.
Housing Tenure
The number of socially rented households in Carlow increased by over 21% between 2011 and 2016. Households in this category constitute almost one-in-eight (11.8%) of all households in County Carlow, and this rate is above the State average (9.4%). The spatial pattern in respect of social housing in County Carlow is one of higher concentrations in the urban centres and low values in rural areas. The highest tier of values (18%) are in Carlow Town, Tullow, Rathvilly and Bagenalstown/ Muinebheag. The second highest tier encompasses Carlow towns immediate environs, Hacketstown, Leighlinbridge and the environs of Bagenalstown. Values are below average in the rest of the county, with the lowest values being in areas of open countryside.
Future Growth - Core Strategy
The current County Development Plan 2015-2021 put in place a core strategy which guides where new development should take place in the county. This includes a settlement strategy for the county which was closely aligned with the Regional Planning Guidelines 2010-2022. As part of the County Development Plan 2022-2028 a new core strategy will be prepared which will be informed by the National Planning Framework including the Implementation Roadmap (July 2018) and the Regional Spatial and Economic Strategy for the Southern Region 2020-2032 (RSES). In accordance with the RSES the core strategy will allocate appropriate levels of population growth having regard to the NPF allocation (see Table 2) and identify a settlement strategy for the county acknowledging the strategic role of various settlements within the county.
Carlow town given its strategic designation as a key town will be recognised for significant growth within the county. Larger settlements like Tullow and Bagenalstown will be considered for growth given the size, location and nature of these settlements and the enhanced role of these settlements supporting their immediate hinterlands. Smaller towns i.e. Hacketstown, Rathvilly, Borris, Ballon, Carrickduff and Leighlinbridge will be subject to Small Town Plans within the new County Development Plan with appropriate levels of zoning identified to facilitate their sustainable development into the future. Smaller villages / settlements within the county will be identified where appropriate for lower levels of growth to support the viability of towns and rural settlements. The scale of growth in all settlements must be considered in light of their capacity to absorb development with the necessary supporting social, community and physical infrastructure. The availability / capacity of Irish Water infrastructure (water and wastewater) is a significant constraint in many small towns and villages throughout the county.
Population Projections Co. Carlow
Table 2: Transitional Population Projections to 2031 (Source: NPF Implementation Roadmap – July 2018- DoHPLG)
|
Year
|
Target
|
|
2026
|
63,000 (+6,000 (10%))
|
|
2031
|
65,500 (+8,500 (14%))
|
QUESTIONS TO CONSIDER
-
Where in Carlow should additional population be focused and how can we ensure that both social and private housing contributes to the creation of sustainable communities?
-
Are there settlements that could absorb greater development and what criteria should be used to determine where it should be provided
-
How can we overcome unevenly distributed growth patterns throughout the county?
-
How can the housing needs of all sectors of our community be adequately addressed?
-
What policies should be integrated into the plan in order to provide the range of family and housing size needs?